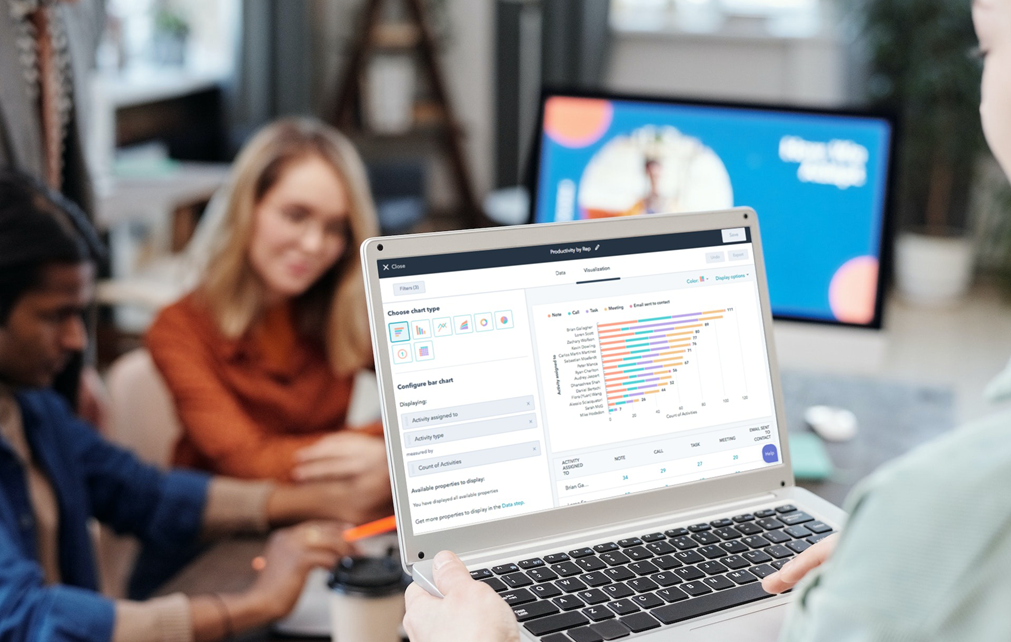
One of the many fast-evolving components of HubSpot is its reporting capabilities. These have improved substantially in recent years, eliminating the need for external reporting tools aside from Excel/Google Sheets. In fact, we use HubSpot Dashboards almost exclusively for quick analysis and metrics reporting for our clients.
Within the past year, HubSpot has not only built up its report library but has also significantly expanded the capabilities of the custom report builder. You will need the custom report builder especially if you’re using a large number of custom properties or doing complex analysis with multiple HubSpot objects.
In its current iteration, the custom reporting tool allows you to create reports based on data from up to five different objects. In addition to object-based reports, customer journey reports, attribution reports, and funnel reports can be created, but we’ll discuss those separately in the future.
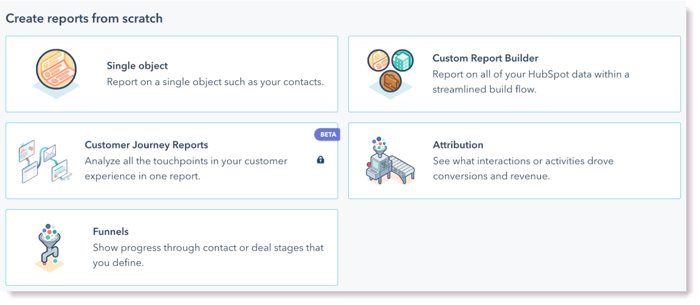
Here’s a quick look at the single object and custom reporting tools.
Single-Object Reports
Single-object reports are the most common reports. HubSpot allows single-object reports to be created for one of eight objects:
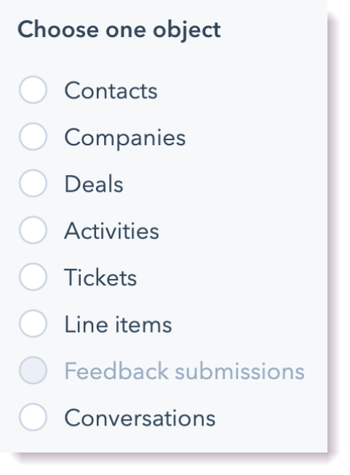
Once you select your object type, you’ll be able to select the properties you want to report on. You can select as many properties as you want on the Data tab.
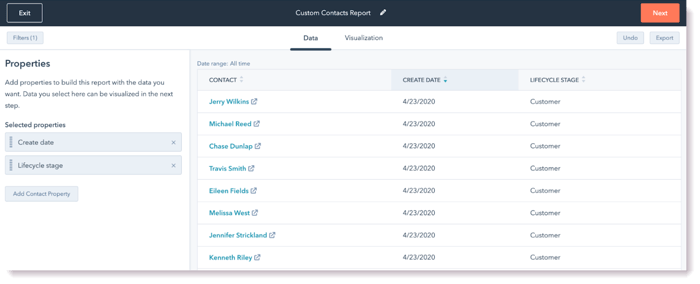
And then choose the ones you want to use to create your table or chart on the Visualization tab. You can also use any number of filters, but if there are multiple filters, they will all use AND logic.
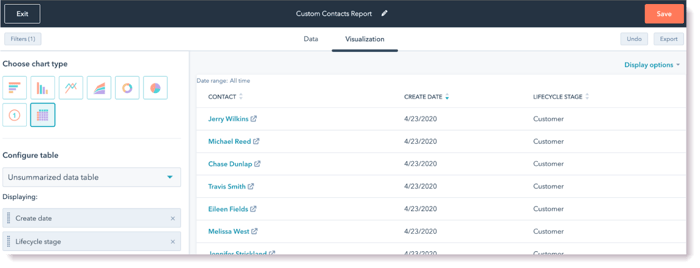
Because of the limited filter options, the custom report builder will be a better option, even if you’re only looking for reporting on a single object.
Need Help With HubSpot - We got you!
Custom Report Builder
Are you looking to report on a combination of deals and companies? Or report on contacts and the landing pages they interact with? Or contacts and sales activities? In these cases, a multiple-object report is the best tool. This functionality inside the custom report builder allows you to build a report that includes properties from 1 to 5 data sources (ideally, limit yourself to 2-3 sources per report), providing a way to get comprehensive insights into what is actually happening with your prospects and customers.
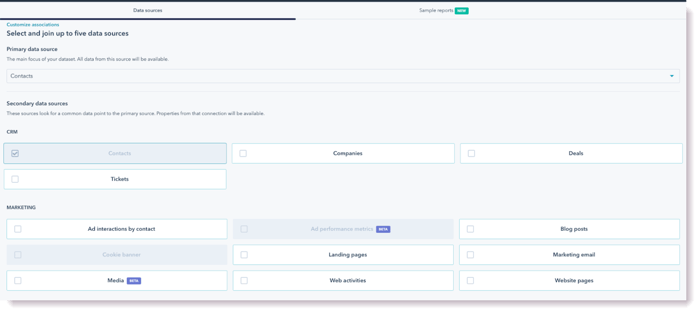
There are over two dozen available reports in the multi-object report tool (the exact number will vary based on your subscription and what functionalities you are using). At the start of the creation process, you can select which data source will be the primary one.
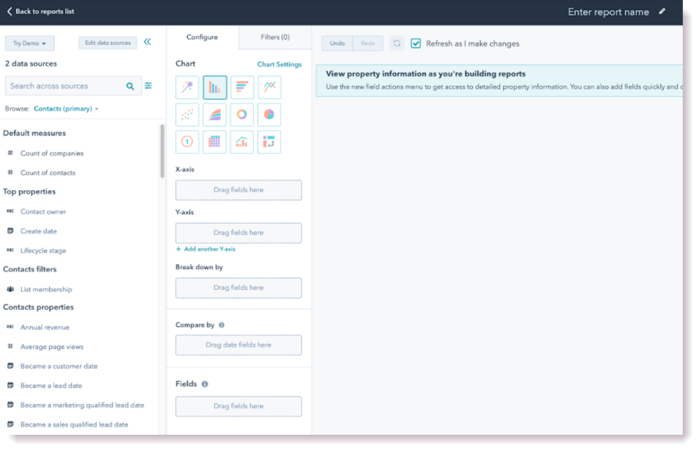
The report configuration screen looks significantly different from the single-object report because you’ll be simultaneously looking at properties (and possibly activity data) from several parts of HubSpot.
Sometimes, a combination of properties won’t return any data or will return weird results. Because behavior can be unpredictable, it's best to first create reports in a table configuration and then set up a visualization (if desired) once you know you’re getting the data you need.
Multiple-Object Reports
In addition, the Multiple-Object Reports tool provides more robust filter options. Here, you get the option of picking OR filter rules instead of AND rules, as well as the ability to your own custom filter rules using a Boolean expression.
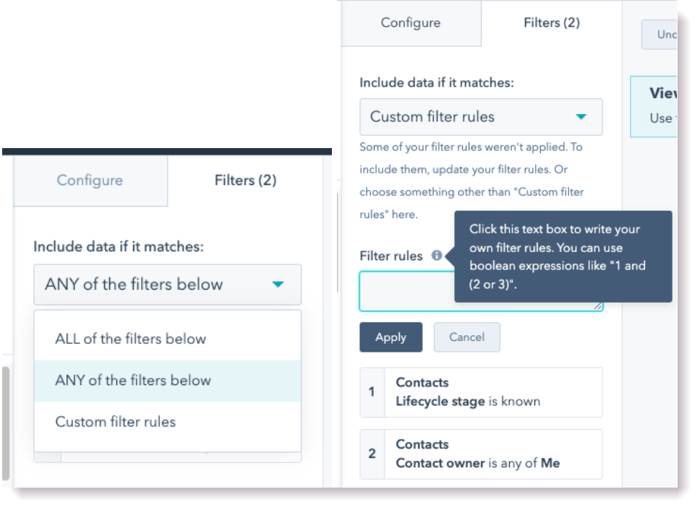
One relatively common way people use this is to create reports that show all contacts that are in a certain lifecycle stage and are owned by several specific sales reps – e.g., the lifecycle stage is Opportunity, and the Contact Owner is Steve or Mary.
Web Analytics Limitations
Despite the significant improvements HubSpot has made to its reporting functionality, one area where it still needs to improve is web analytics. While the built-in Traffic Analytics reporting works reasonably well for surface-level traffic analysis, it doesn’t make it easy to glean insights such as “top organic pages.”
Unfortunately, neither does the custom reporting tool since web traffic isn’t an object. Even though “web activities” and “website pages” are available as data sources, you won’t be able to create a report that will show your landing pages with the volume of traffic broken down by source – and the associated contacts created through each. At present, you can only get this by collecting the data individually from each landing page, which is inefficient and breaks down if you have a significant amount of landing pages to analyze.
Hopefully, HubSpot will make it possible to create custom web analytics reports in the near future as the data is clearly there – it's just not accessible outside of pre-built sections.
Create Reports With a Dashboard In Mind
Though sometimes it's necessary to create a report to answer a specific question, in most cases, you'll be able to craft better reports if you go into the task with a dashboard in mind. Given the number of options available for creating reports, it can be easy to get lost if you’re just exploring the tool.
Additionally, while reports can be accessed directly from the Reports list, they work best when added to a relevant dashboard where they can be grouped with other reports on the subject to provide full context and create a comprehensive view. For example, for a sales dashboard, you may want to create reports that look at both deals and contacts. For a campaign dashboard, you’ll want a mix of sales and marketing reports so that you can get a view of how the campaign has performed at generating leads that convert into potential customers.
