.png)
HubSpot’s latest updates bring fresh ways to dig deeper into your data, clean up your lists, and track where your traffic is really coming from. Whether you're an administrator looking to optimize forms, improve email deliverability, or understand how AI tools like ChatGPT are driving website visits, this week’s improvements are all about clarity and control.
Here’s what’s worth taking a look at this week:
- Build Custom Reports on Form Submission,
- Healthy/Unhealthy Lists in Email Health, and
- AI Referrals in Website Traffic Analytics.
Build Custom Reports on Form Submission
Hubspot has announced the Public beta for supporting form submissions as a data source in the Custom Report Builder.
You can now build a variety of reports based on form submissions to understand how your forms are performing, slice and dice form submissions data and much more.
How does it work?
- Under custom report builder, select "Forms", "Form Submissions" and "Form Analytics" as the data sources. Also select other required data sources such as Contacts, Companies etc.
- Using the various data sources selected, pull the required fields.
- Apply the necessary filters
- Choose the appropriate chart types for your report.
- Break down the selected data as required.
- Now, you should see the report populated
- You can also add the reports your dashboards.
Below are some of the reports that you can build:
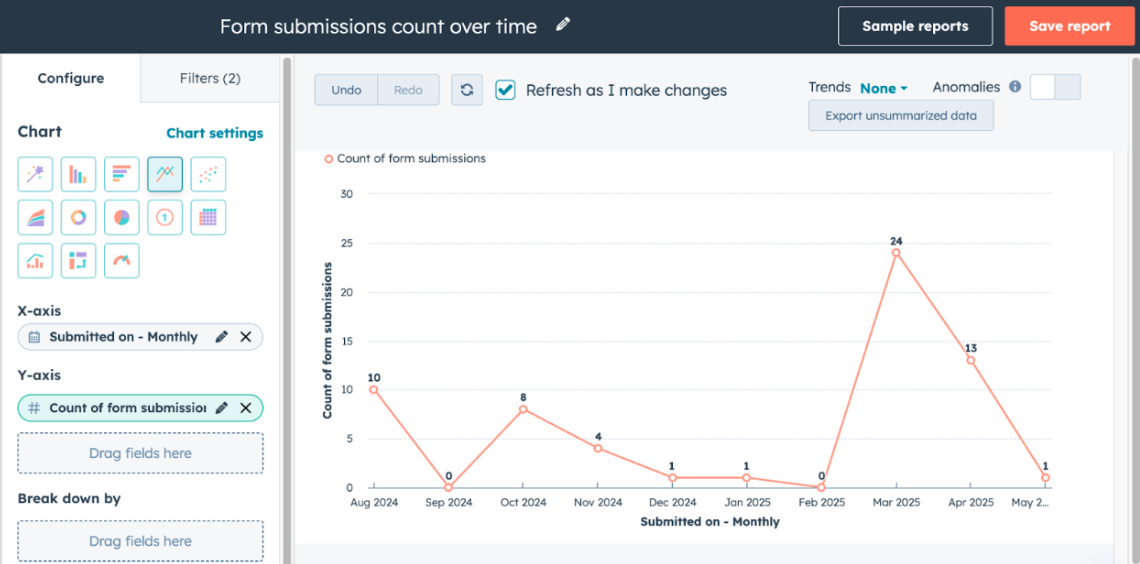
- Form submissions count over time
- Data Sources to Select: Form Submissions(Primary), Forms
- Properties to select:
- X-axis : Submitted on
- Y-axis : Count of form submissions
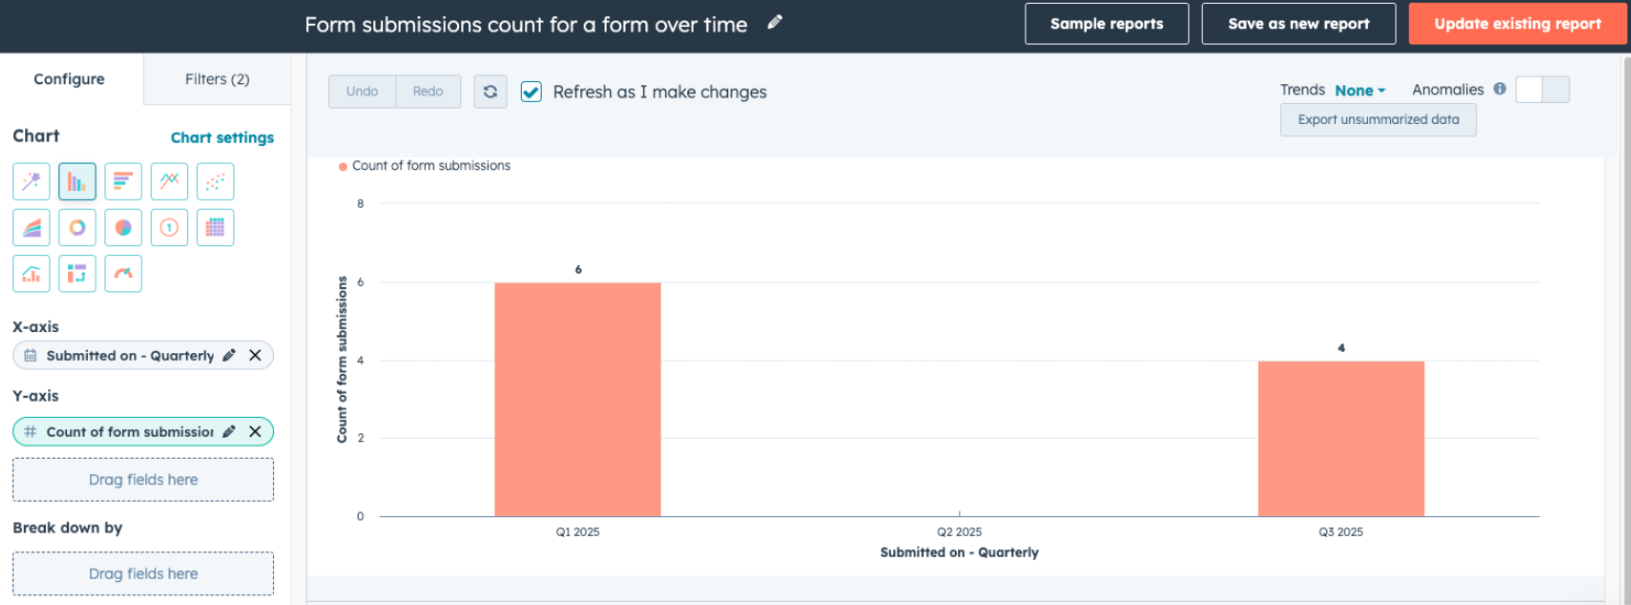
- Form submissions count for a form over time
- Data Sources to Select: Form Submissions(Primary), Forms
- Properties to select:
- X-axis : Submitted on
- Y-axis : Count of form submissions
- Filter by: Name(Form Name)
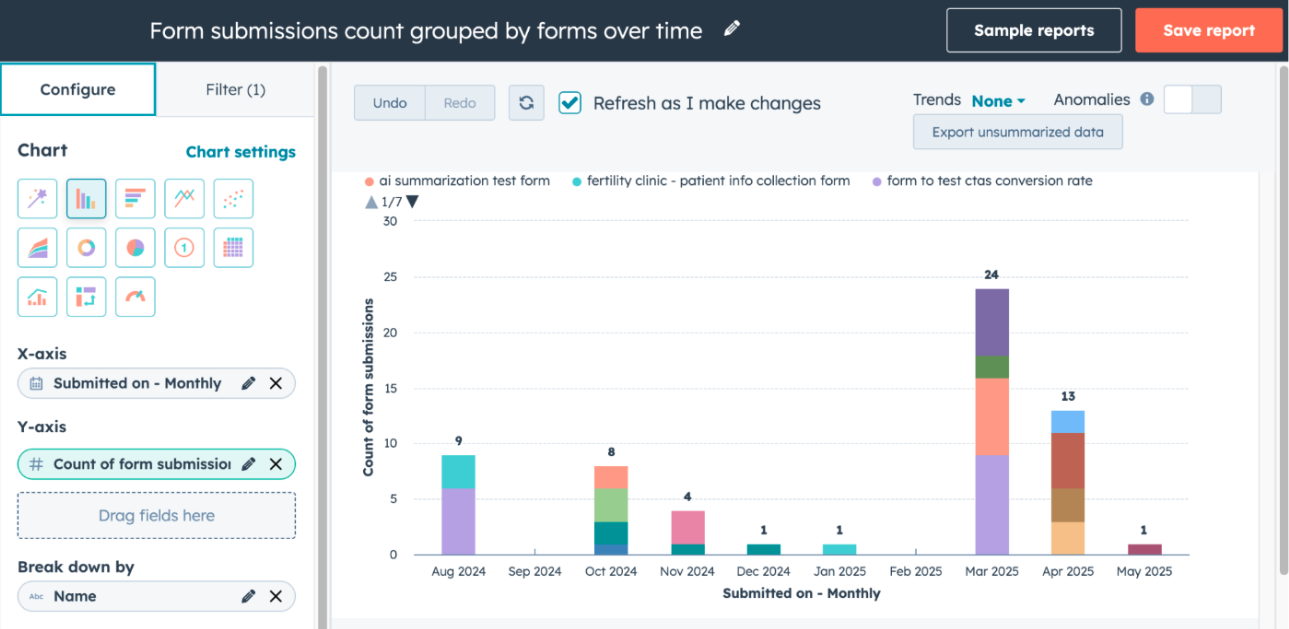
- Form submissions count grouped by forms over time
- Data Sources to Select: Form Submissions(Primary), Forms
- Properties to select:
- X-axis : Submitted on
- Y-axis : Count of form submissions
- Break down by : Name (Form name)
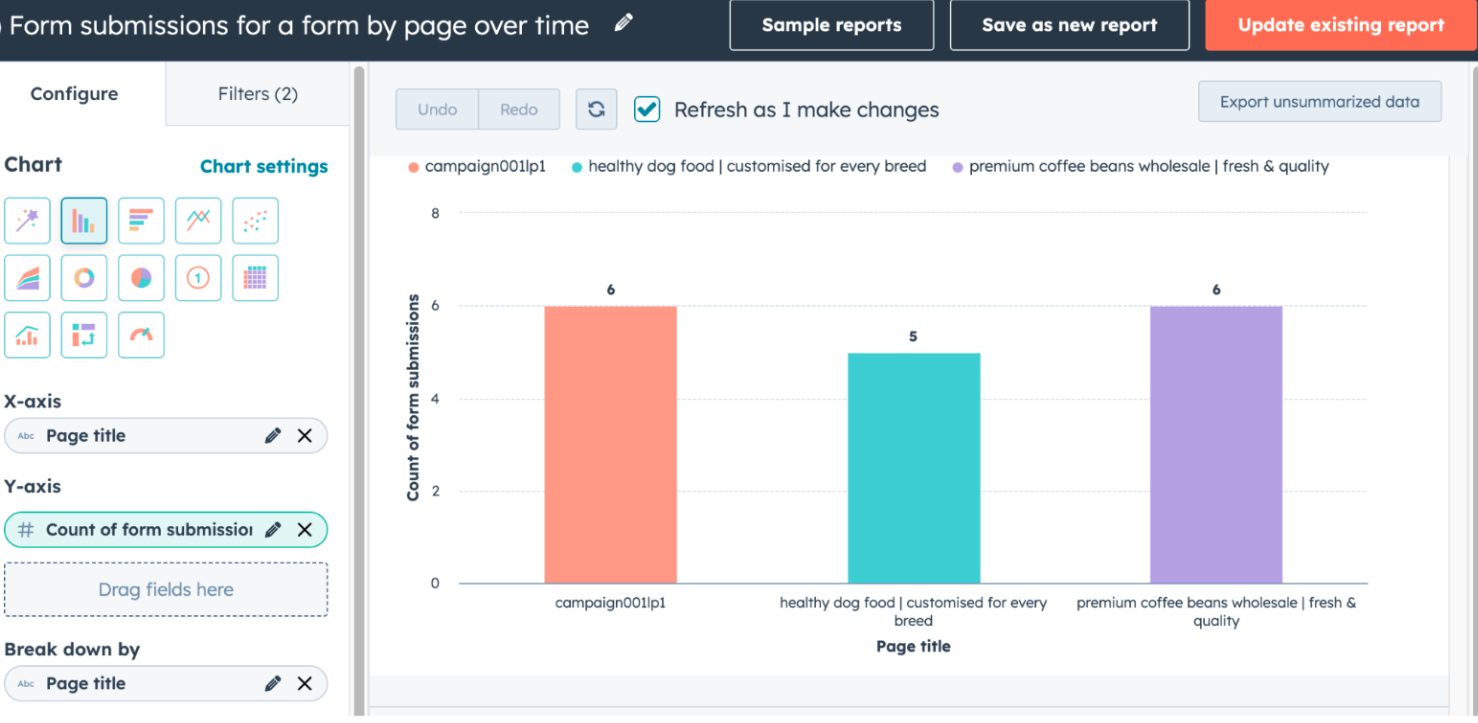
- Form submissions count for a form by page over time
- Data Sources to Select: Form Submissions(Primary), Forms
- Properties to select:
- X-axis : Page title
- Y-axis : Count of form submissions
- Break down by : Page title
- Filter by : Name(Form name)
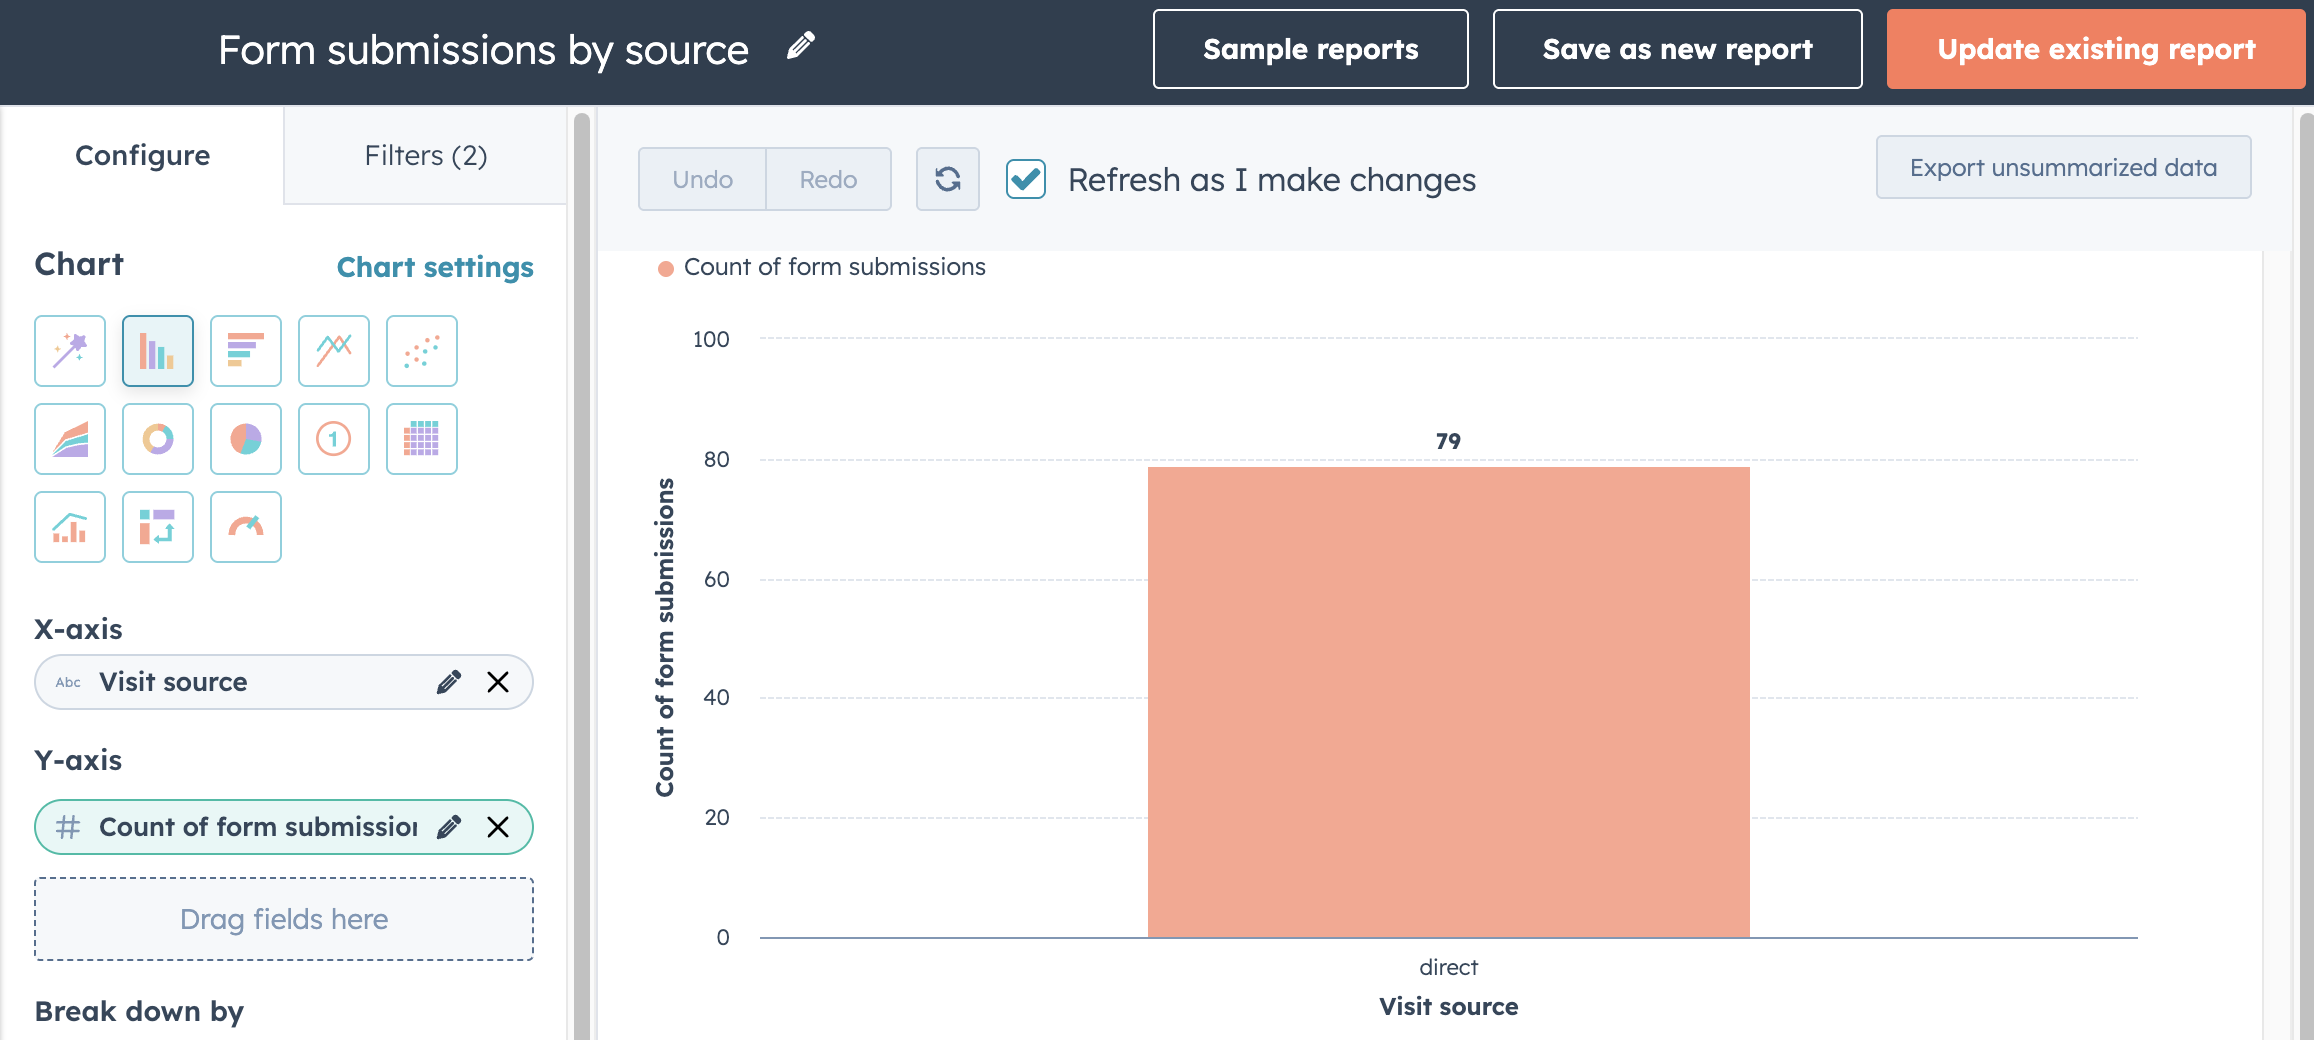
- Form submissions count by source
- Data Sources to Select: Form Submissions(Primary), Forms
- Properties to select:
- X-axis : Visit Source
- Y-axis : Count of form submissions
- Break down by : Visit Source
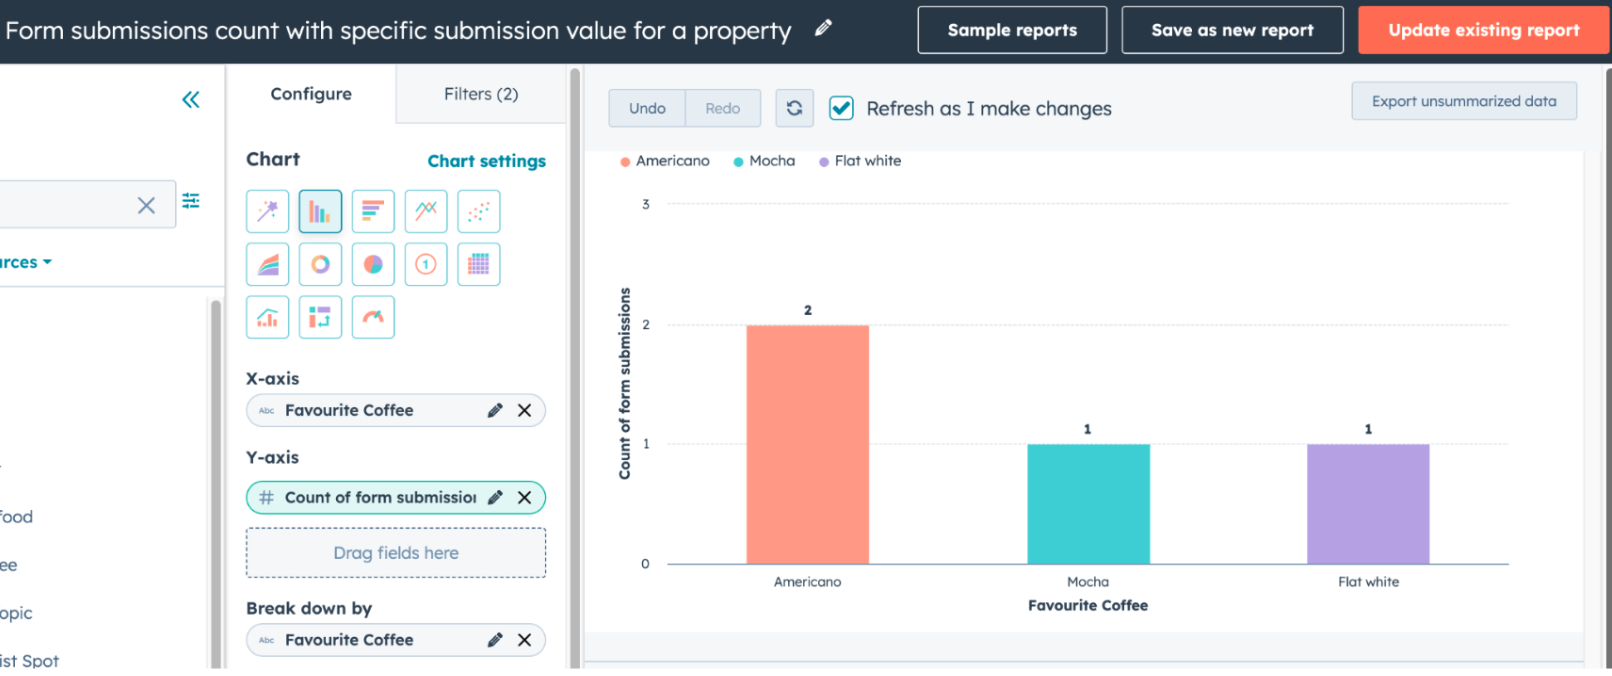
- Form submissions count with specific submission value for a property
- Data Sources to Select:Form Submissions(Primary), Contacts
- Properties to select:
- X-axis : Property of choice (Example: Favorite Coffee)
- Y-axis : Count of form submissions
- Break down by : Property of choice (Example: Favorite Coffee)
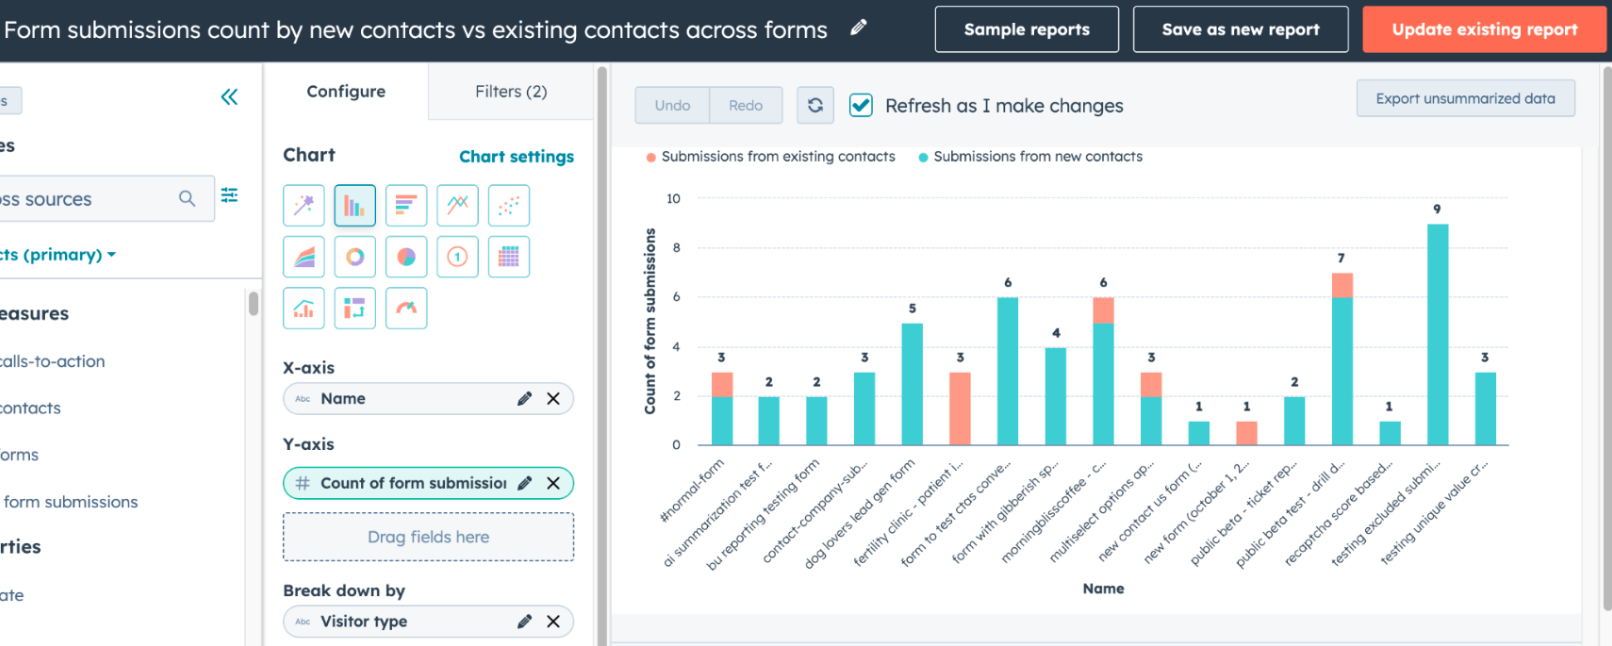
- Form submissions count by new contacts vs existing contacts across forms
- Data Sources to Select: Form Submissions(Primary), Forms
- Properties to select:
- X-axis : Name (Form Name)
- Y-axis : Count of form submissions
- Break down by : Visitor Type
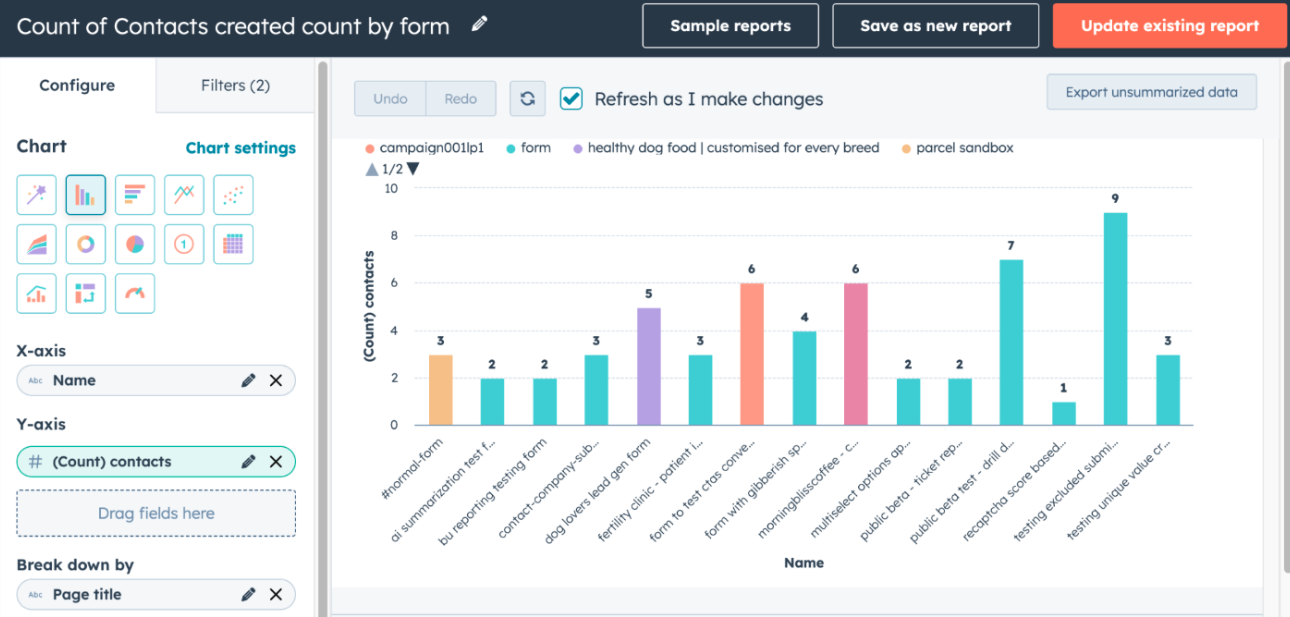
- Count of Contacts created by form
- Data Sources to Select: Form Submissions(Primary), Forms
- Properties to select:
- X-axis : Name (Form Name)
- Y-axis : Count of Contacts
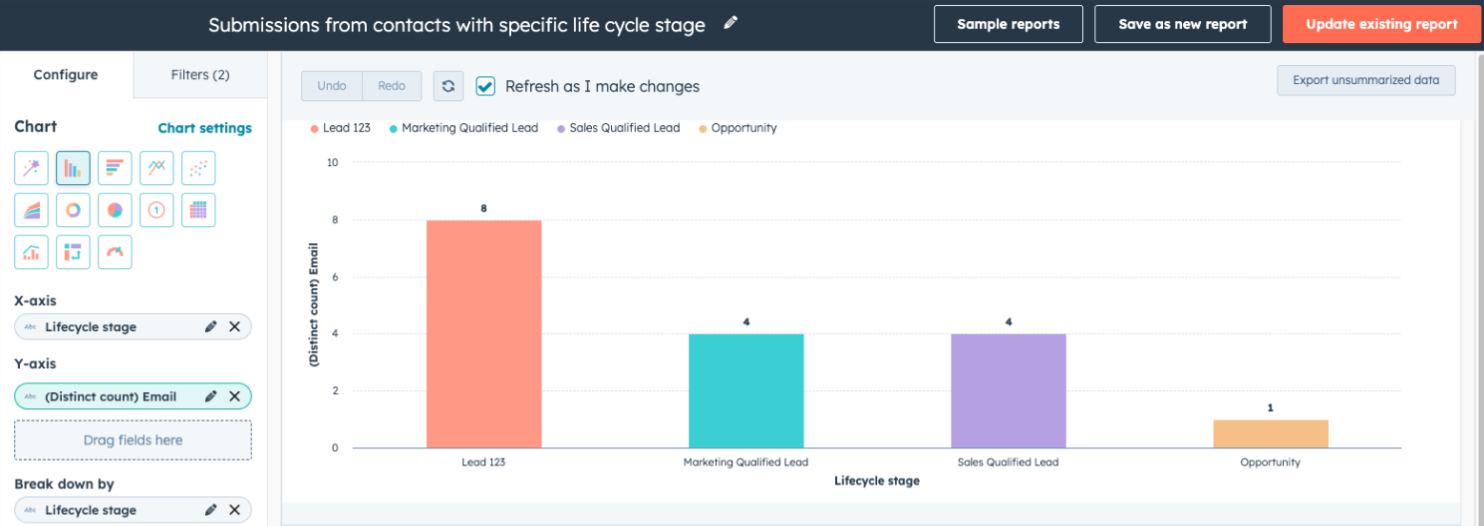
- Submissions from contacts with specific life cycle stage
- Data Sources to Select: Form Submissions(Primary), Forms
- Properties to select:
- X-axis : Lifecycle stage
- Y-axis : Distinct Count of Email
- Breakdown by : Lifecycle stage
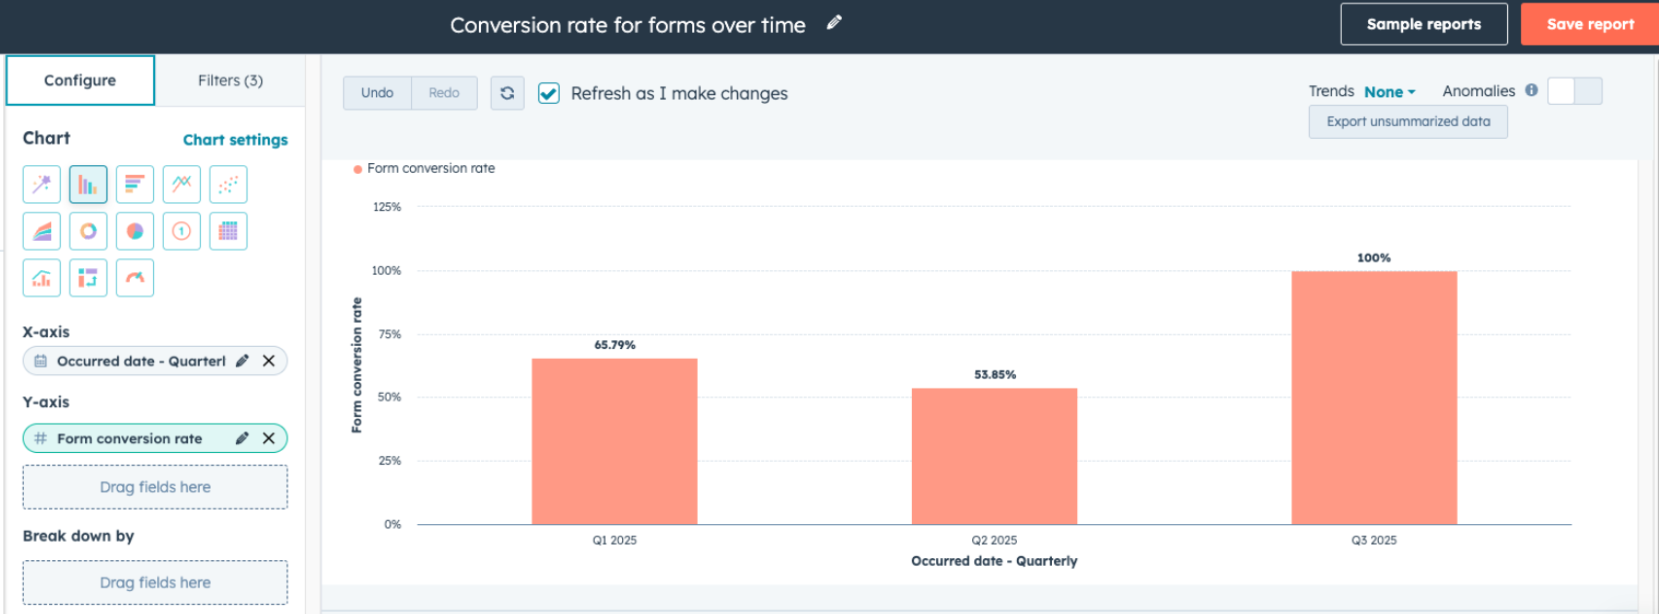
- Conversion rate for forms over time
- Data Sources to Select: Form Analytics(Primary), Forms
- Properties to select:
- X-axis : Occurred Date
- Y-axis : Form Conversion Rate
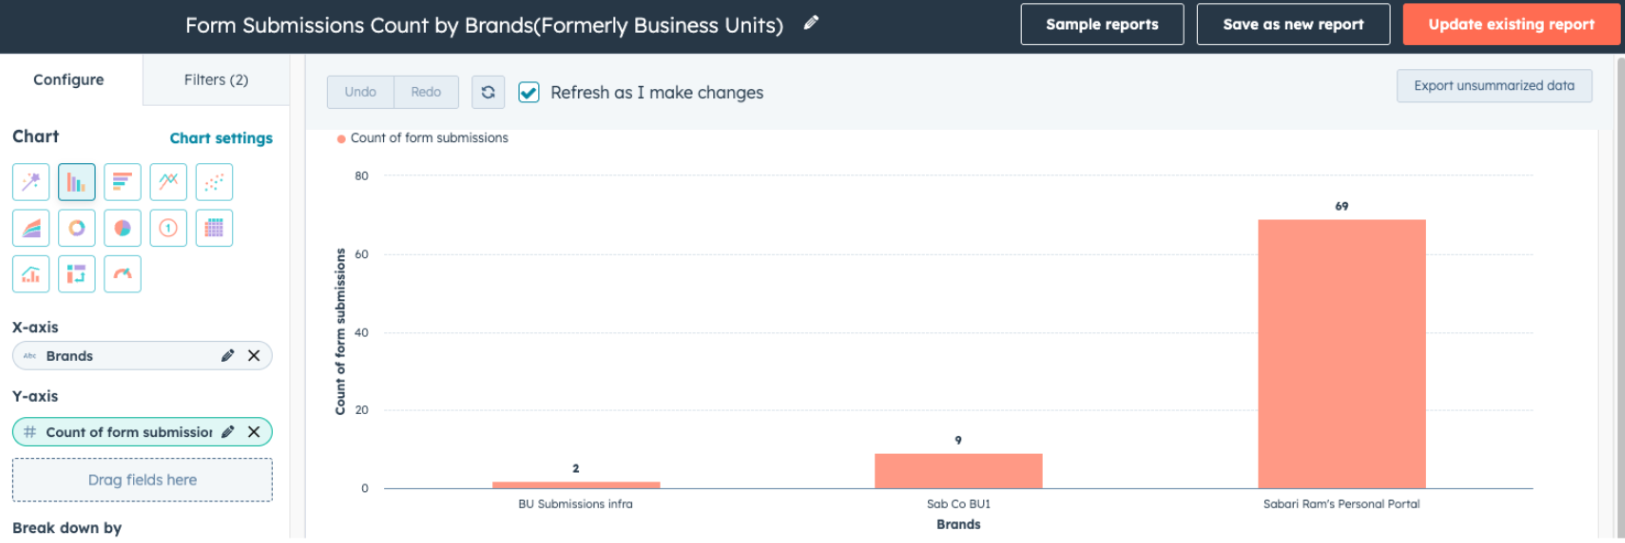
- Form submissions Count by Brand
- Data Sources to Select: Form Submissions, Forms
- Properties to select:
- X-axis : Brands (from Contacts data source)
- Y-axis : Count of form submissions
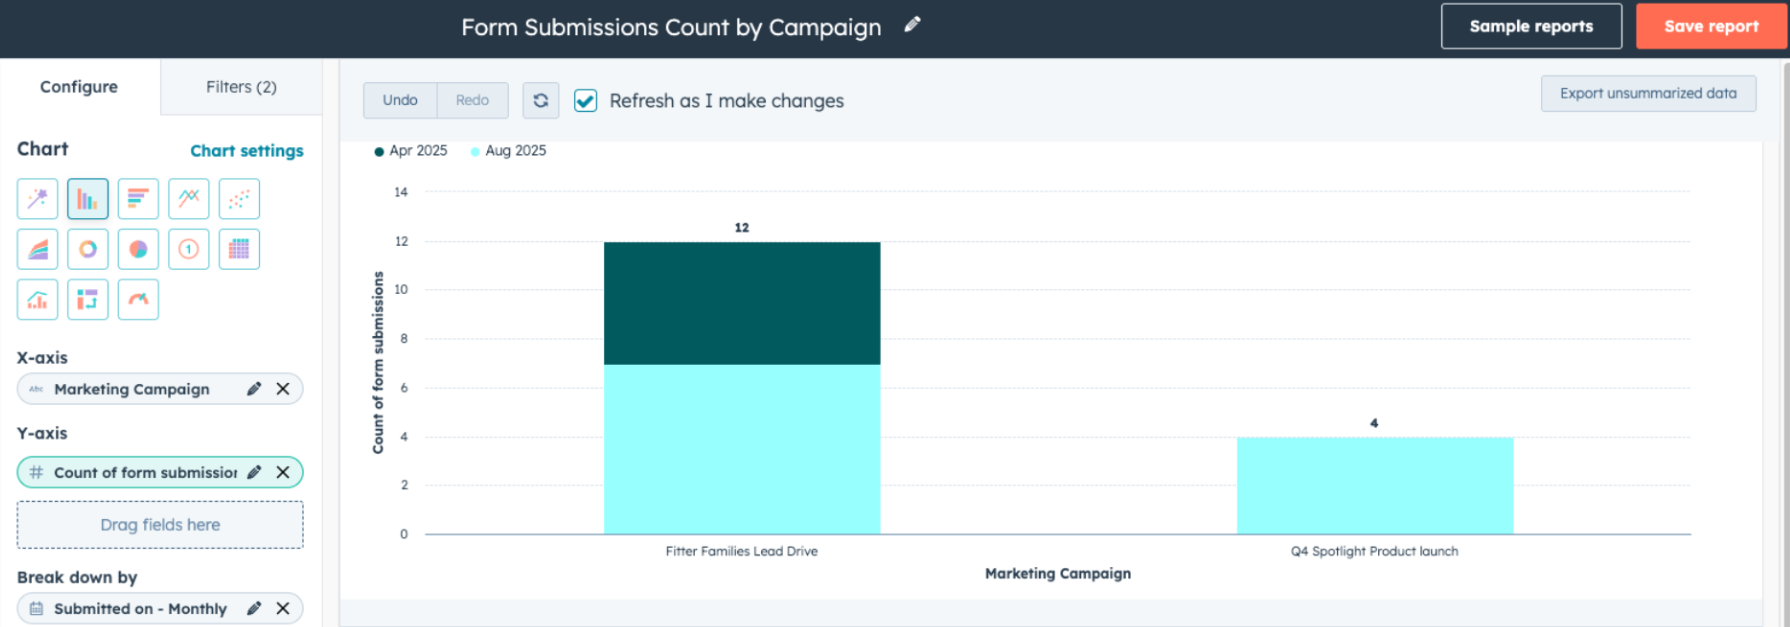
- Form submissions Count by Campaign
- Data Sources to Select: Form Submissions, Forms
- Properties to select:
- X-axis : Marketing Campaign (from Forms data source)
- Y-axis : Count of form submissions
- Break down by: Submitted on (from Form Submissions data source)
Healthy/Unhealthy Lists in Email Health
You can now view a new report within the Email Health dashboard to surface the healthiest and unhealthiest performing recipient lists based on key engagement and delivery metrics.
Email lists with poor performance can damage your sender reputation and reduce overall deliverability, while your best-performing lists represent valuable insights for optimizing your email strategy. Understanding which lists drive strong engagement versus those that hurt your metrics helps you focus your efforts where they'll have the greatest impact on ROI and customer relationships.
How does it work?
In the Marketing Email App > Health, marketers will be able to view a new report in email health displaying the top 10 highest performing lists and lowest performing lists that contribute to their email health.
High-performing lists are those with strong results across all key delivery metrics — open rate, click rate, hard bounce, unsubscribe, and spam rate. Low-performing lists are those that perform poorly in at least one of these metrics. For each list shown, marketers will see a breakdown of its performance across these five metrics to better understand what’s driving its classification.
AI Referrals in Website Traffic Analytics
A new traffic source classification in website traffic analytics that identifies visitors arriving via AI platforms (e.g., ChatGPT, Claude, Perplexity) when they click on cited sources. This feature automatically detects known AI platform domains and surfaces them as their own source category in reporting.
Why does it matter?
Traffic from AI platforms is currently grouped under "Other Websites," making it impossible to measure AI's impact on lead generation. By clearly identifying AI referral traffic, you can better understand how these emerging platforms contribute to awareness, engagement, and conversions.
How does it work?
When a visitor clicks a cited link in an AI platform and lands on your site, the system detects the AI platform's domain in the referral data. This traffic is then classified under the new AI platform referrals category in website traffic analytics. Classification happens automatically based on domain — no action is required to enable this feature. You can build reports to specifically track AI referrals data in Reports > Analytics Tools > Traffic Analytics.
Don’t Just Track AI, Market to It
As HubSpot helps you identify how AI platforms are driving traffic to your site, it’s a good time to ask: is your content actually optimized for those AI platforms? Being visible in ChatGPT or Perplexity is no longer a bonus, it’s a strategy.
Download our guide, Marketing to AI: Your New Audience, to learn 10 essential tactics for making your content discoverable by AI .
